
For growers with CHP, lighting and flexibility
Greenhouse horticulture
For growers who want to better visualise gas, electricity, CHP, lighting, heat buffering and market impact.
Pricing model
Modular per meter, confirmed after scope
Start with Consumption Analysis per meter. You only add Financial Analysis and Capacity Analysis when they add value.
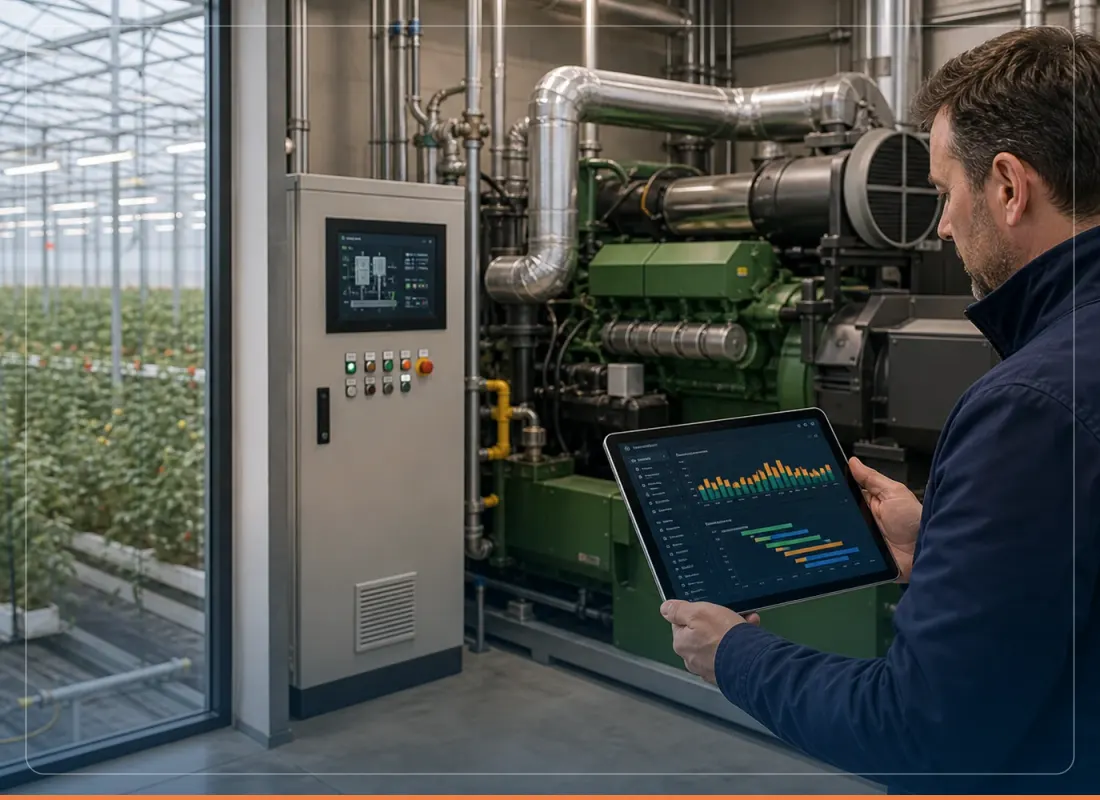 Greenhouse horticulture
01
The approach
From recognizable situations to concrete data questions.
02
Sector profile
Quarter-hour values reveal peaks and baseload consumption.
03
Where the money is
Cost, capacity and anomalies come together in an action view.

The approach
The greenhouse already steers. Now on energy too.
Lighting, screens, CHP and CO₂ dosing are adjusted every hour in the greenhouse. COMCAM sets the energy profile alongside climate and market price, so every cultivation decision also becomes a substantiated energy decision.
Recognise
The quarter-hour profile is placed alongside climate and price data. Offtake and feed-in both become visible, because the greenhouse has two sides.
Explain
For every steering decision it is recorded what it delivered: running on heat demand, selling into the peak or curtailing at negative prices.
Steer
Lighting and CHP dispatch move with the market, within the limits of the crop. The feed-in limit is guarded instead of discovered.
Where greenhouse horticulture often runs into trouble.
Energy Intelligence is positioned differently for each sector. The value lies in recognisable situations, not in generic dashboards.
Complex energy position
CHP and lighting
Gas and electricity
Market impact
The energy model
Greenhouse horticulture
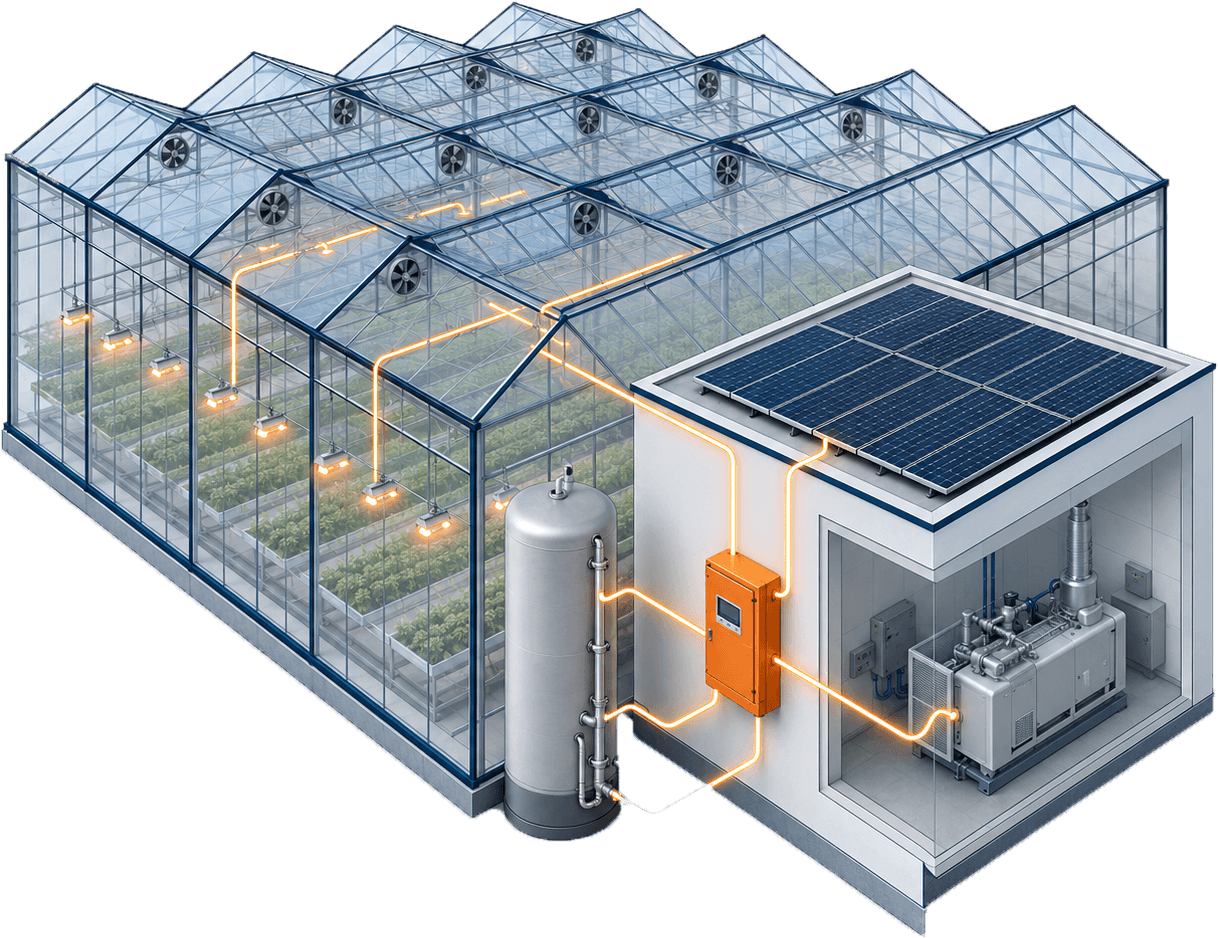
Where consumption, generation and steering come together in this sector: from meters and cooling to solar panels and charging infrastructure.
Sector profile
The greenhouse profile: lighting, CHP and sun turn the greenhouse into a power plant.
Day profile in quarter-hour valuesNight lighting
Lit cultivation runs at full power at night: the profile is upside down compared with other sectors.
Morning transition
Lights off, screens open: the transition shows how sharply you steer on daylight and price.
Midday dip: own generation
CHP and solar cover demand; the grid sees almost nothing, or you export. At negative prices every steering decision counts.
Contracted capacity
Offtake and feed-in each have their own limit. The profile guards both sides.
Where the money is
Three insights that make the difference in greenhouse horticulture.
The greenhouse already steers. The question is whether you measure it
Lighting, screens, CHP and CO₂ dosing are adjusted every hour. Without quarter-hour values alongside climate and price data, the energy side of those decisions stays invisible.
CHP dispatch has become a market decision
Run on your own heat demand, sell into the EPEX peak or apply curtailment at negative prices: the right choice changes by the hour. The profile records what each choice delivered.
Feed-in deserves the same attention as offtake
Export limits and negative prices make the generation side a steering question too. Measure only offtake and you see half the greenhouse.
Energy Intelligence for greenhouse horticulture.
Start with Consumption Analysis per meter. You only add Financial Analysis and Capacity Analysis when they add value.
Consumption Analysis
Base rate per meter for consumption, locations and trends.
Book a no-obligation callRead on in the knowledge base.
In-depth articles on exactly these questions: substantiation, practical examples and step-by-step plans.
Greenhouse horticulture
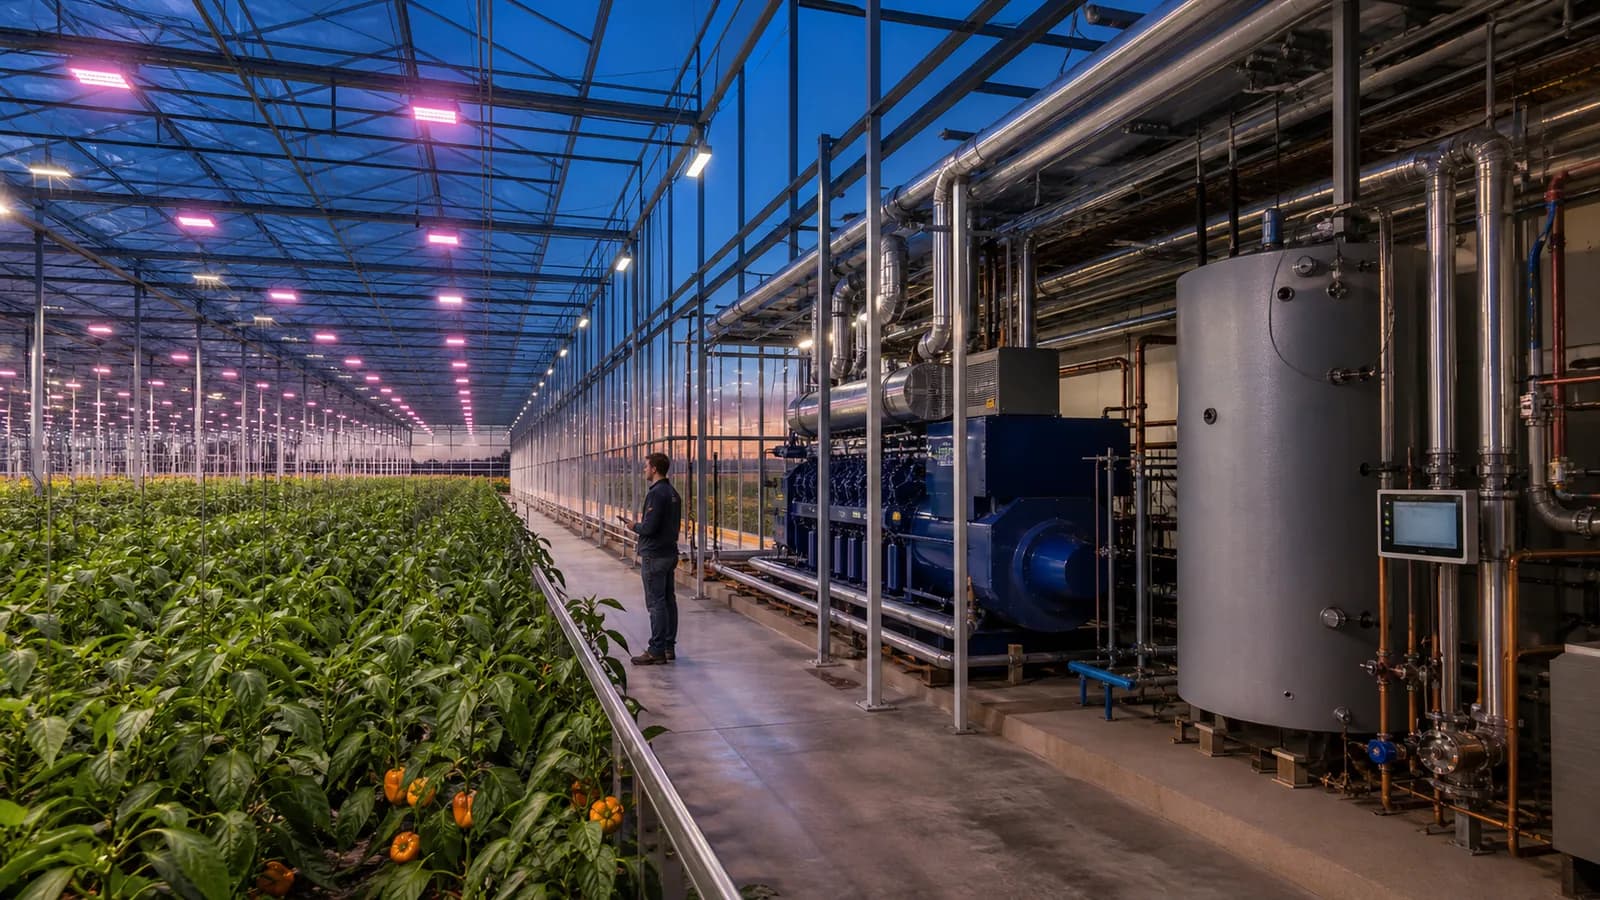
How do I optimise energy in greenhouse horticulture or my greenhouse?
Optimising energy in greenhouse horticulture requires coherence between heat, electricity, CO2, lighting, screening, CHP and market prices. A dashboard alone is not enough; the value lies in steering production conditions and energy costs simultaneously.
Read article
Sector: Greenhouse horticulture
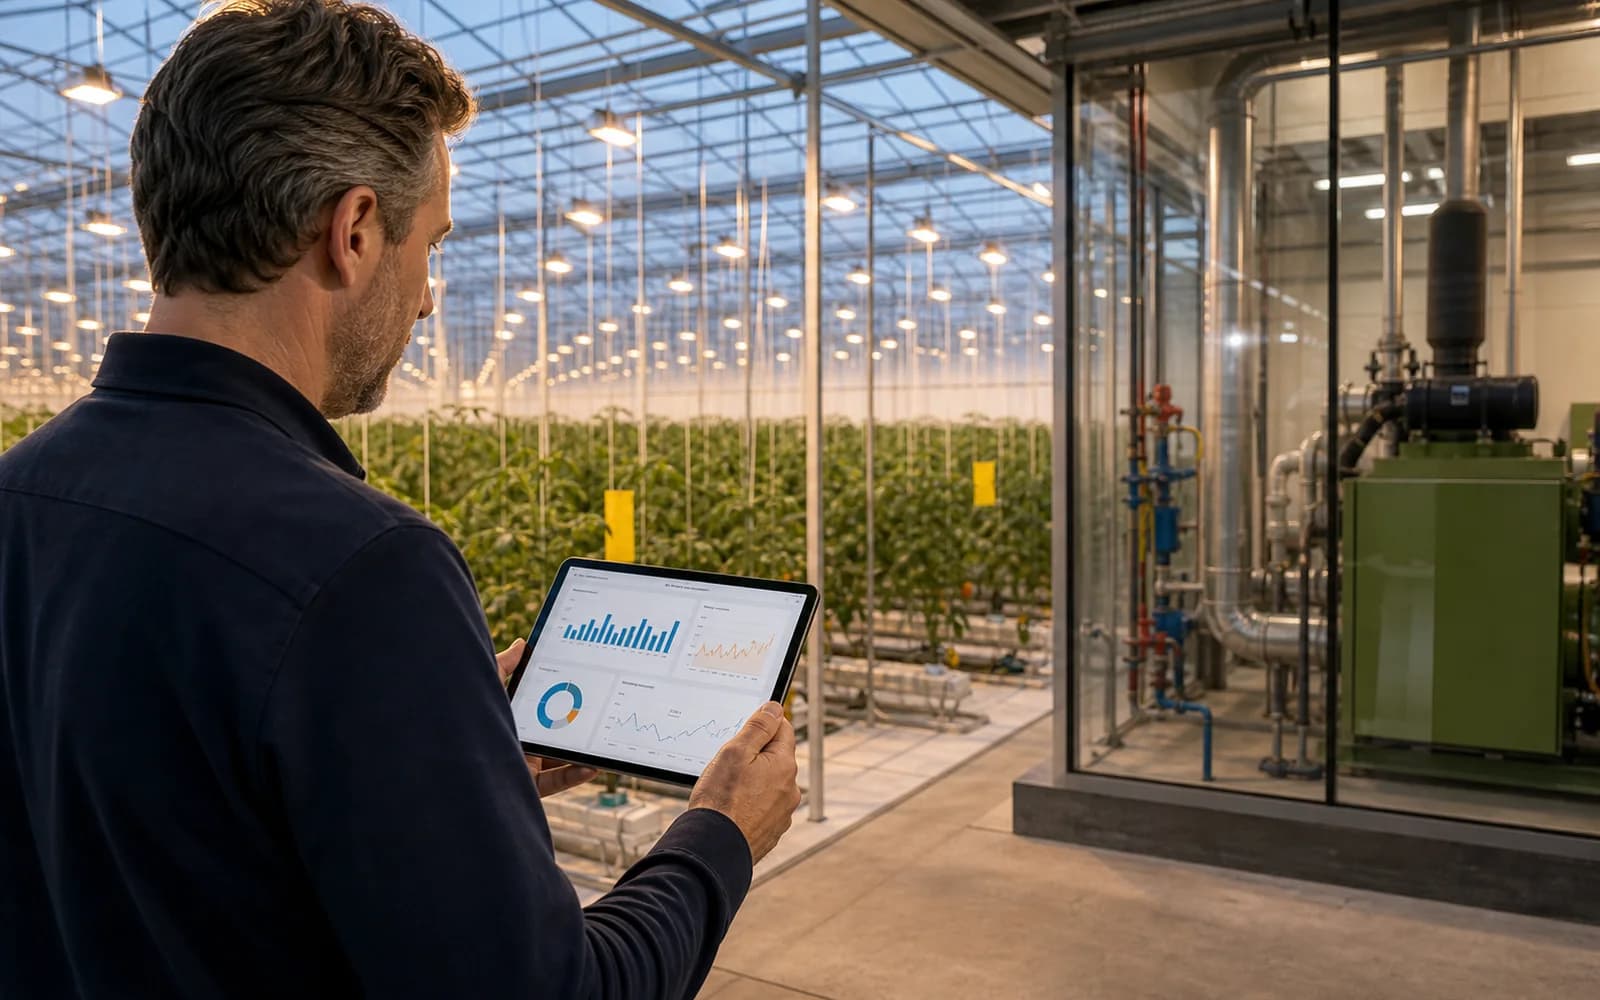
Getting a grip on greenhouse energy costs: CHP, lighting and crop plan in one view
Getting a grip on greenhouse energy costs begins where the climate computer stops: by bringing gas consumption, electricity, CHP running hours, grid export and lighting together into a financial picture per crop and per section. COMCAM lays that energy profile, supplier-independently, alongside your crop plan, so you can see whether the greenhouse did what the planning promised, and where running hours, screen positions or lighting blocks leave money on the table.
Read article
Flexibility
How do I earn money with the flexibility of my battery or CHP?
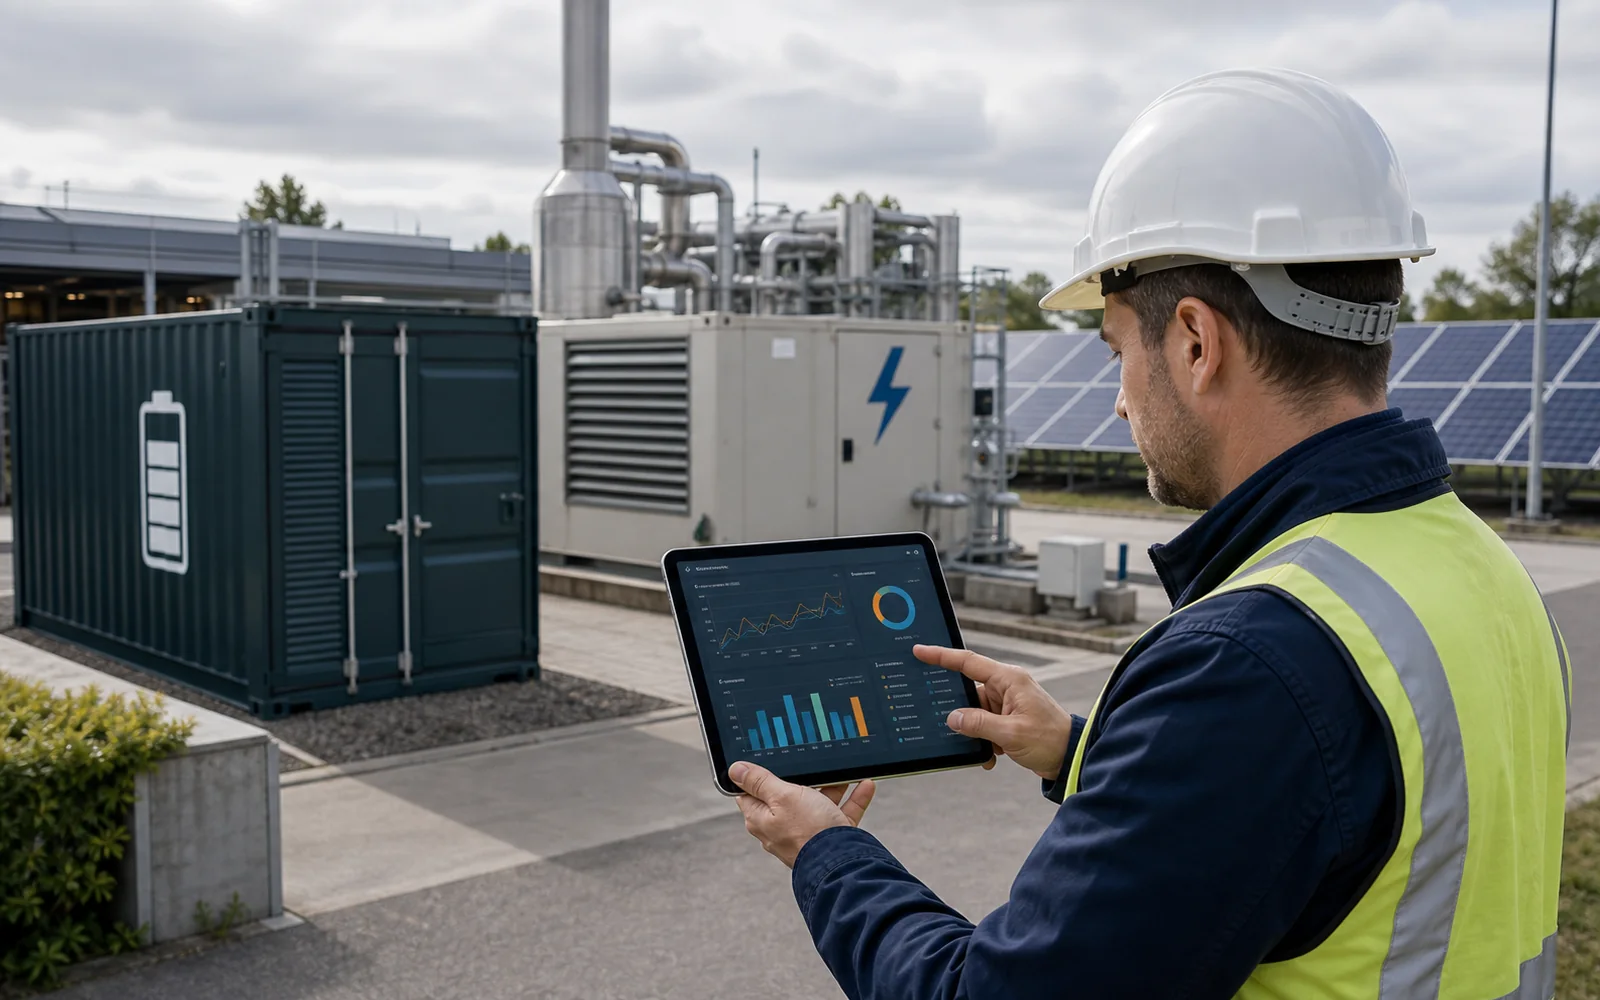
Earning money with the flexibility of a battery or CHP is possible when you can shift, supply or avoid power or energy at valuable moments. This requires reliable measurement data, market context, technical limits, contractual arrangements and risk management.
Read article
Frequently asked questions about energy insight in greenhouse horticulture.
From metering data and savings opportunities to capacity, regulation and a practical start.
01Where is the first measurable saving opportunity in greenhouse horticulture?
The greenhouse already steers. The question is whether you measure it. Lighting, screens, CHP and CO₂ dosing are adjusted every hour. Without quarter-hour values alongside climate and price data, the energy side of those decisions stays invisible.
02Which deviations and decisions become visible through comparison in greenhouse horticulture?
CHP dispatch has become a market decision. Run on your own heat demand, sell into the EPEX peak or apply curtailment at negative prices: the right choice changes by the hour. The profile records what each choice delivered.
03Which strategic decision can the energy profile substantiate?
Feed-in deserves the same attention as offtake. Export limits and negative prices make the generation side a steering question too. Measure only offtake and you see half the greenhouse.
04Which patterns appear in the energy profile of greenhouse horticulture?
Night lighting: Lit cultivation runs at full power at night: the profile is upside down compared with other sectors. Morning transition: Lights off, screens open: the transition shows how sharply you steer on daylight and price.
05How does capacity analysis support expansion or electrification?
Offtake and feed-in each have their own limit. The profile guards both sides. COMCAM compares quarter-hour values with contracted capacity, so additional demand can be assessed before investment decisions are made.
06Which energy data does COMCAM need for greenhouse horticulture?
The foundation consists of quarter-hour values per meter and location. Where available, COMCAM adds gas data, contracted capacity, tariffs, operating hours and relevant asset data. Access is arranged through authorisation or an existing data connection.
07Are additional sensors or submeters always required?
No. Existing smart meters and telemetry data are the logical starting point. Submetering is only added where the main profile cannot answer a specific process question with sufficient precision.
08Which Dutch energy-saving obligations may apply to a location?
In the Netherlands, the energy-saving obligation currently applies from 50,000 kWh of electricity or 25,000 m³ of natural-gas equivalent per location per year. Measures with a payback period of no more than 5 years must be implemented. An extension to 7 years is intended for 1 July 2027, but the five-year threshold remains in force until the change is final. The exact obligation depends on the location, use and activity.

Get in touch
Let your energy data work for you.
Book a no-obligation call. We discuss your energy question, look at your own metering data and whether structural insight adds value.
- Response within one working day
- Dashboard with your own data
- Supplier-independent
- No commitments