
For care sites, clinics and institutions
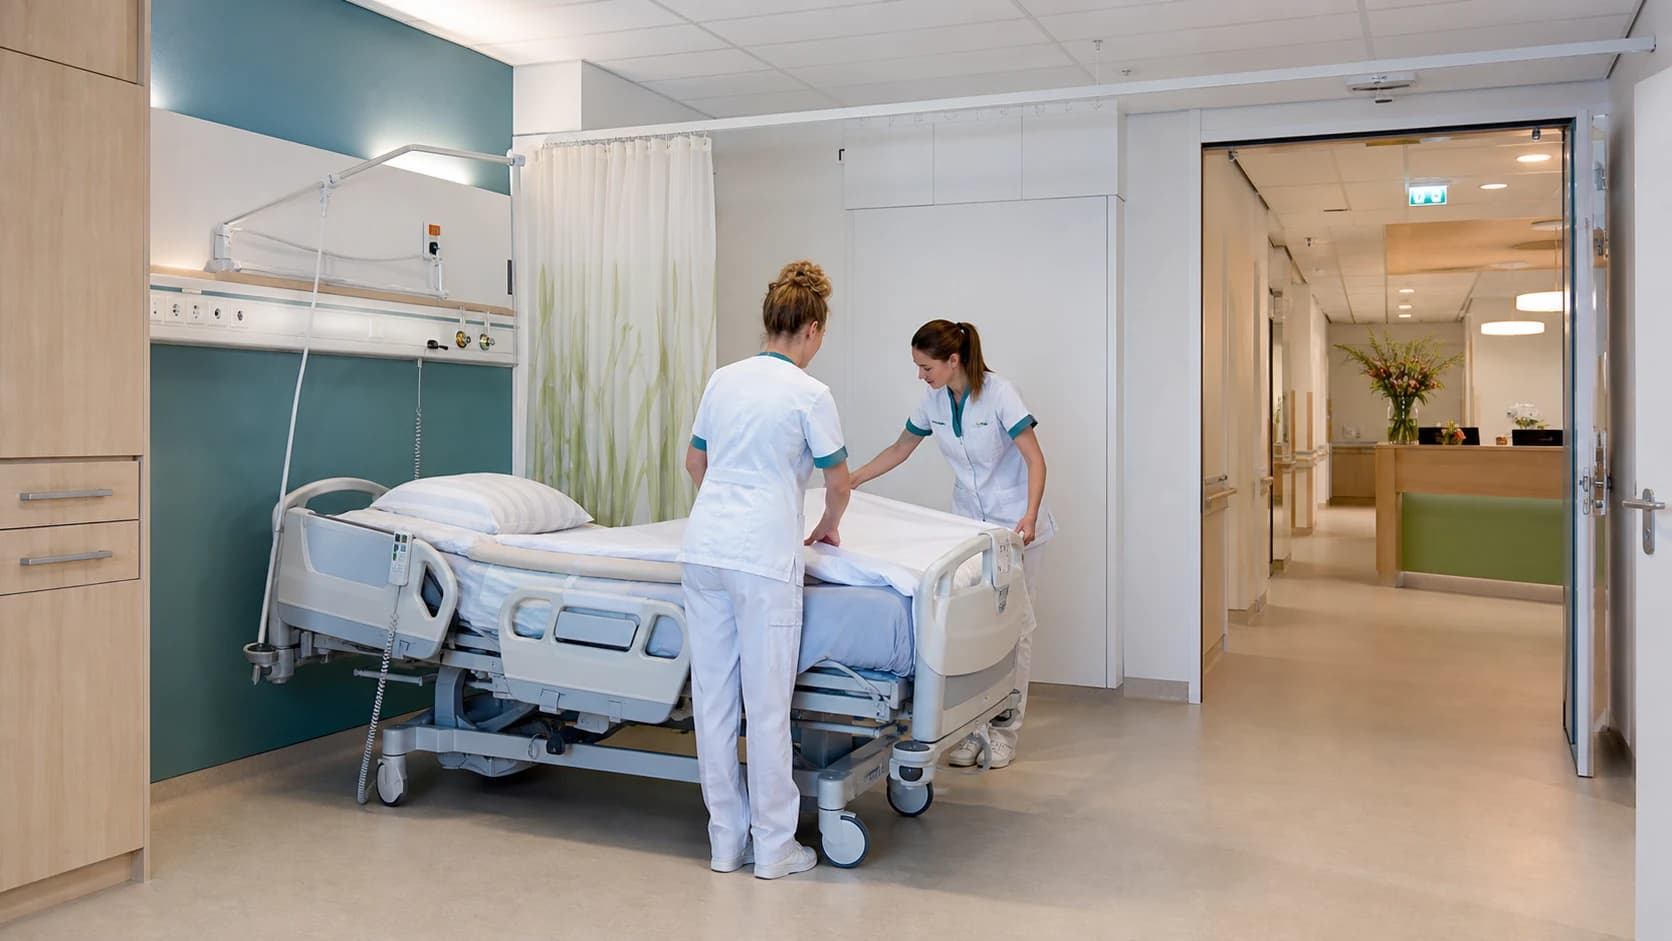
Healthcare institutions
Monitor continuous consumption, buildings, deviations and costs. Focused on calm, reliability and clear reporting.
Pricing model
Modular per meter, confirmed after scope
Start with Consumption Analysis per meter. You only add Financial Analysis and Capacity Analysis when they add value.
 Healthcare institutions
01
The approach
From recognizable situations to concrete data questions.
02
Sector profile
Quarter-hour values reveal peaks and baseload consumption.
03
Where the money is
Cost, capacity and anomalies come together in an action view.

The approach
Continuity first, savings at the edges.
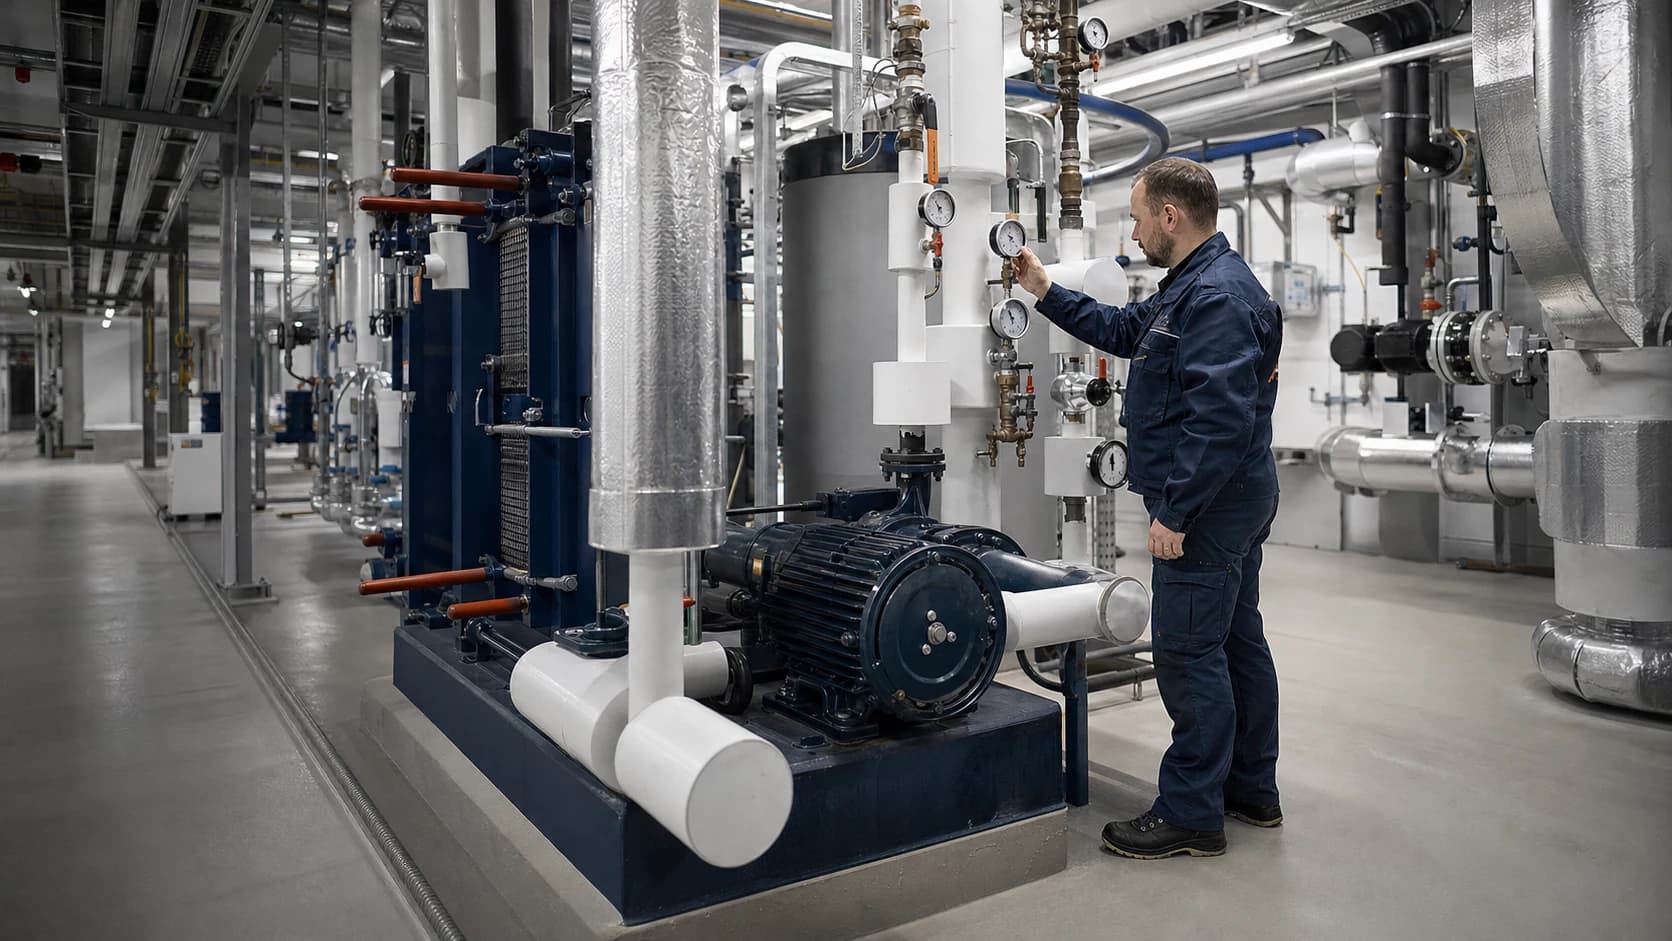
Care never stops. Climate systems, medical equipment and kitchens form a constant floor that no one may simply touch. COMCAM makes precisely that floor transparent, so you save where it is safe and safeguard what must not give way.
Recognise
The continuous baseload becomes visible per site and per installation. You see what runs around the clock and why.
Compare
Sites are compared objectively, without clipboard rounds. Deviations come from the data, not from the corridors.
Steer
Processes that can safely be shifted are moved, the rest stays safeguarded. Electrifying transport and cooking gets a substantiated plan.
Where healthcare institutions often runs into trouble.
Energy Intelligence is positioned differently for each sector. The value lies in recognisable situations, not in generic dashboards.
Continuous consumption
Comfort requirements
Budget pressure
Multiple buildings
Sector profile
The healthcare profile: 24/7 continuity, with savings potential at the edges.
Day profile in quarter-hour valuesContinuous baseload
Care never stops: climate systems, medical equipment and kitchen form a high, constant floor.
Morning peak
Care routines, kitchen and laundry all at once. Spreading processes can lower the peak without touching the care.
Evening round
Second peak around evening care and meals, recognisable per site and easy to compare across sites.
Contracted capacity
Electrifying transport and cooking takes headroom. The profile shows how much there really is.
Where the money is
Three insights that make the difference in healthcare institutions.
In a 24/7 environment every percent of baseload counts double
Whatever runs continuously consumes 8,760 hours a year. A small reduction of the floor (cooling, ventilation, humidification) yields more than a big saving on something that is rarely on.
Compare sites without disrupting the care
Metering data compares objectively: consumption per bed, per square metre, per site. That reveals which site deviates, without clipboard rounds.
Security of supply and savings are not opposites
Precisely those who know the profile know which processes can safely be shifted, and which are untouchable.
Energy Intelligence for healthcare institutions.
Start with Consumption Analysis per meter. You only add Financial Analysis and Capacity Analysis when they add value.
Consumption Analysis
Base rate per meter for consumption, locations and trends.
Book a no-obligation callRead on in the knowledge base.
In-depth articles on exactly these questions: substantiation, practical examples and step-by-step plans.
Care
Which energy management suits a care institution?
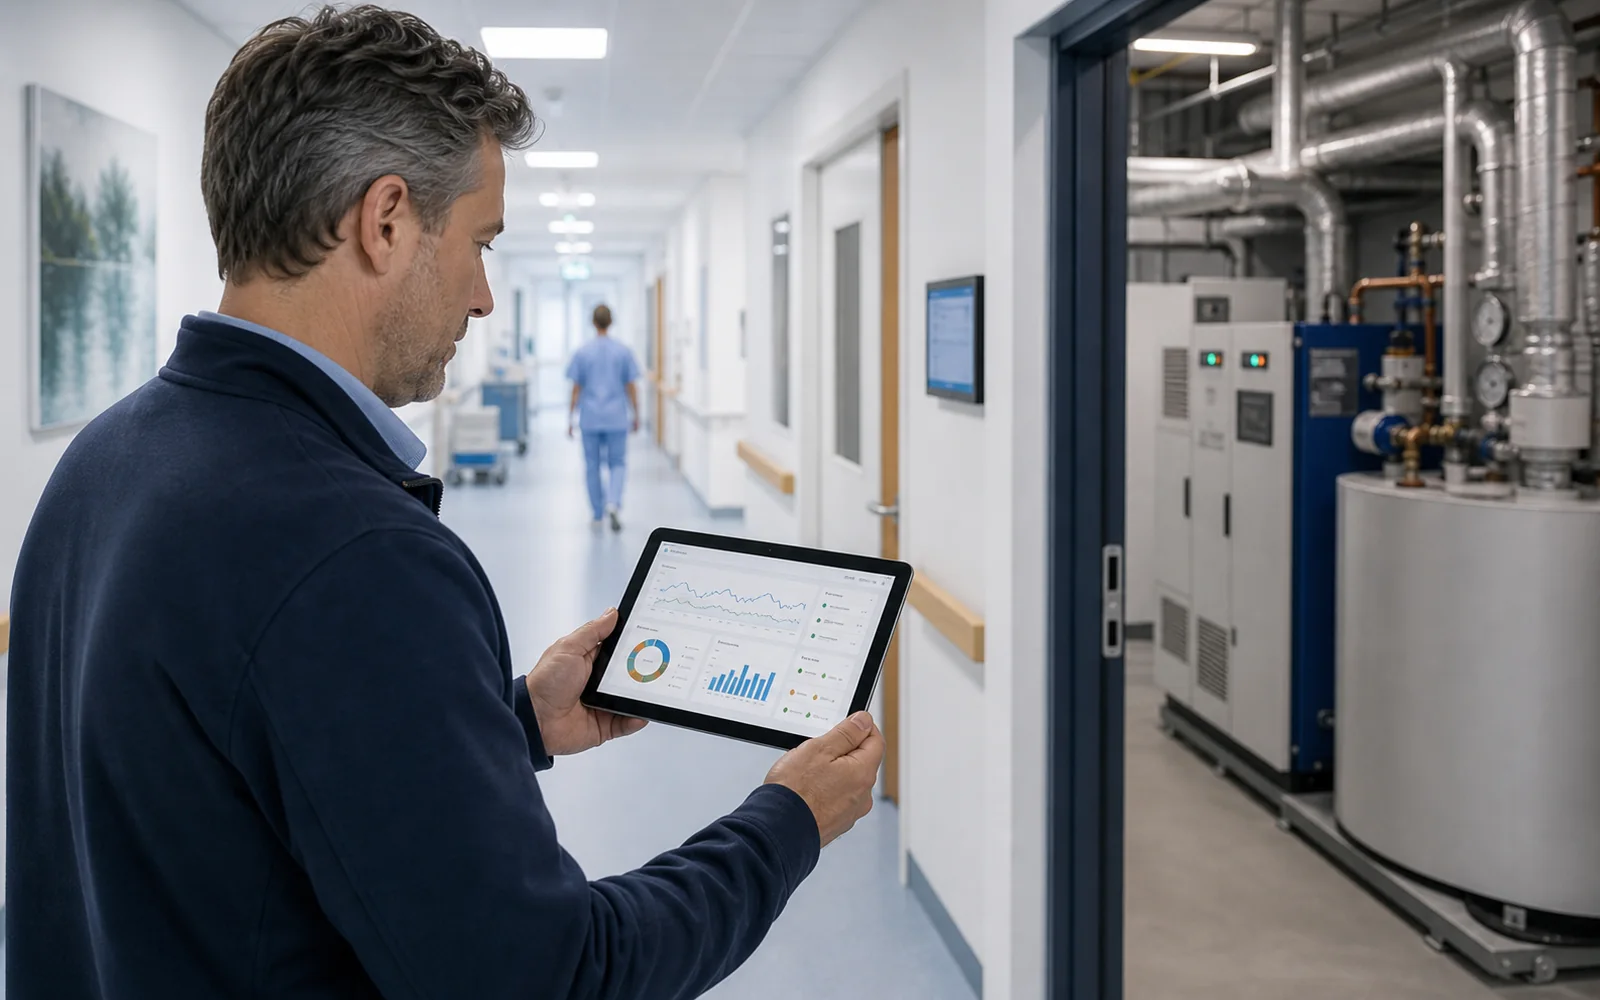
Energy management for care institutions must be reliable, calm and practical. Continuous consumption, comfort, multiple buildings, budget monitoring, reporting and deviation detection without extra workload for care teams are essential.
Read article
Sector: Healthcare
Cutting energy costs across care sites without compromising on comfort
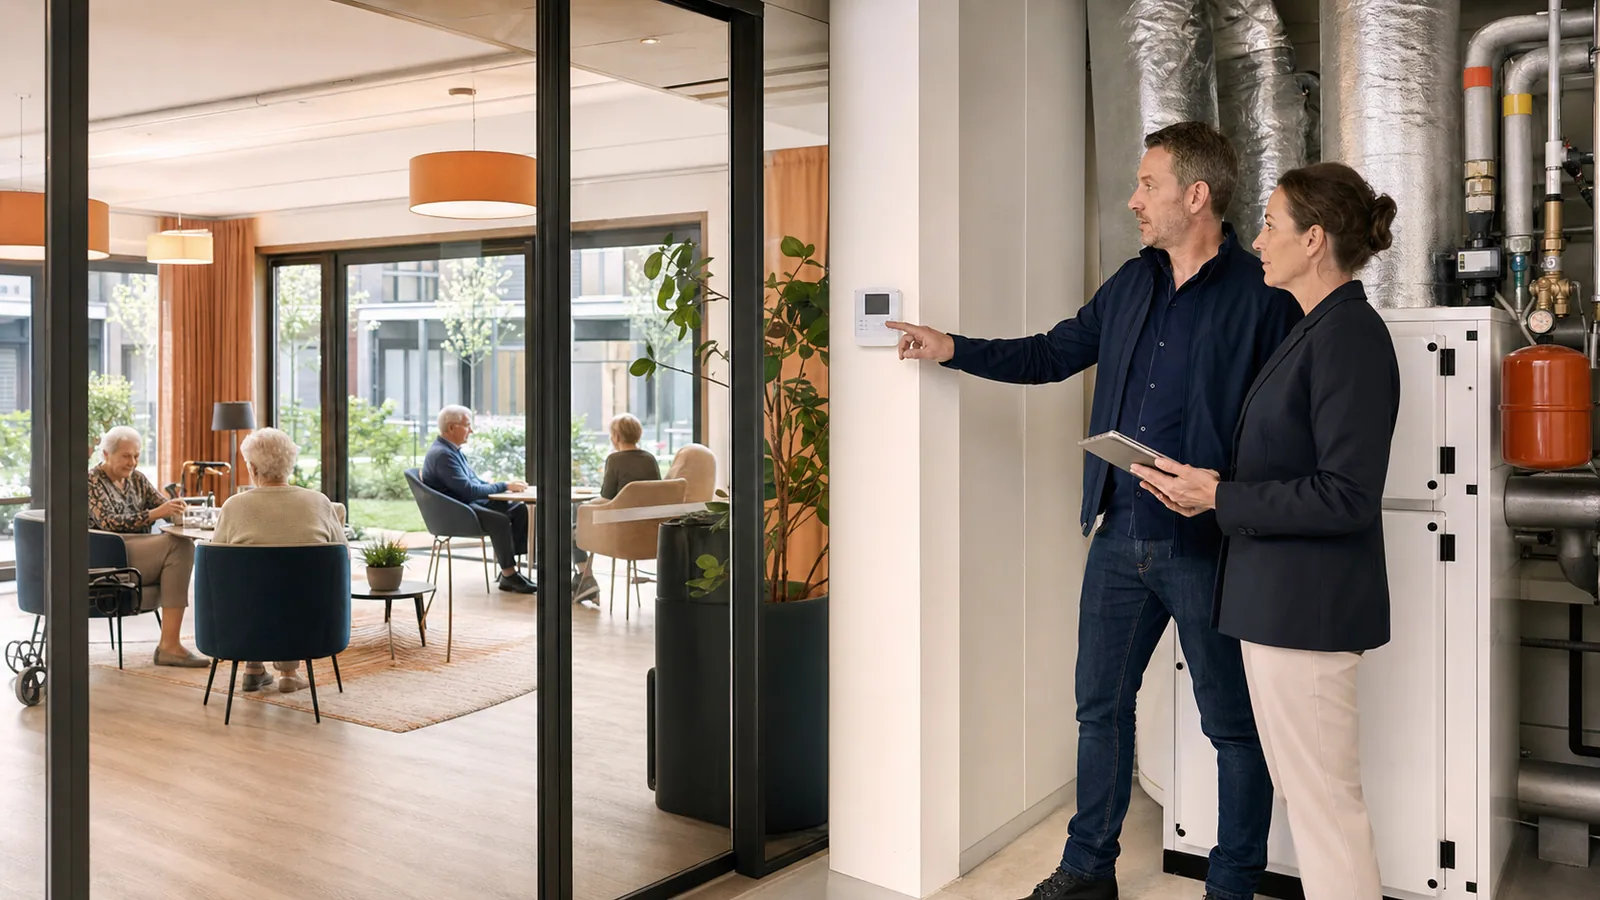
You cut the energy costs of care sites by finding waste that has nothing to do with residents' comfort: ventilation running at full load in empty rooms, heating without a night setback and installations that have drifted out of tune. COMCAM compares all your sites centrally and flags anomalies automatically, so a small facilities team keeps a grip on many buildings. Every euro that does not go on energy stays available for care.
Read article
Healthcare real estate
How do I monitor energy in a hospital or healthcare real estate?
You monitor energy in a hospital or healthcare real estate by looking at continuous consumption, installations, building zones, comfort requirements and costs together. The solution must be reliable, because saving must not disrupt continuity, safety and care processes.
Read article
Frequently asked questions about energy insight in healthcare institutions.
From metering data and savings opportunities to capacity, regulation and a practical start.
01Where is the first measurable saving opportunity in healthcare institutions?
In a 24/7 environment every percent of baseload counts double. Whatever runs continuously consumes 8,760 hours a year. A small reduction of the floor (cooling, ventilation, humidification) yields more than a big saving on something that is rarely on.
02Which deviations and decisions become visible through comparison in healthcare institutions?
Compare sites without disrupting the care. Metering data compares objectively: consumption per bed, per square metre, per site. That reveals which site deviates, without clipboard rounds.
03Which strategic decision can the energy profile substantiate?
Security of supply and savings are not opposites. Precisely those who know the profile know which processes can safely be shifted, and which are untouchable.
04Which patterns appear in the energy profile of healthcare institutions?
Continuous baseload: Care never stops: climate systems, medical equipment and kitchen form a high, constant floor. Morning peak: Care routines, kitchen and laundry all at once. Spreading processes can lower the peak without touching the care.
05How does capacity analysis support expansion or electrification?
Electrifying transport and cooking takes headroom. The profile shows how much there really is. COMCAM compares quarter-hour values with contracted capacity, so additional demand can be assessed before investment decisions are made.
06Which energy data does COMCAM need for healthcare institutions?
The foundation consists of quarter-hour values per meter and location. Where available, COMCAM adds gas data, contracted capacity, tariffs, operating hours and relevant asset data. Access is arranged through authorisation or an existing data connection.
07Are additional sensors or submeters always required?
No. Existing smart meters and telemetry data are the logical starting point. Submetering is only added where the main profile cannot answer a specific process question with sufficient precision.
08Which Dutch energy-saving obligations may apply to a location?
In the Netherlands, the energy-saving obligation currently applies from 50,000 kWh of electricity or 25,000 m³ of natural-gas equivalent per location per year. Measures with a payback period of no more than 5 years must be implemented. An extension to 7 years is intended for 1 July 2027, but the five-year threshold remains in force until the change is final. The exact obligation depends on the location, use and activity.

Get in touch
Let your energy data work for you.
Book a no-obligation call. We discuss your energy question, look at your own metering data and whether structural insight adds value.
- Response within one working day
- Dashboard with your own data
- Supplier-independent
- No commitments