
For fish farms, RAS systems and breeding sites
Aquaculture
For fish farms and RAS systems where pumps, aeration, water treatment and temperature control run continuously. Make consumption, peaks and deviations visible without a heavy consultancy project.
Pricing model
Modular per meter, confirmed after scope
Start with Consumption Analysis per meter. You only add Financial Analysis and Capacity Analysis when they add value.
 Aquaculture
01
The approach
From recognizable situations to concrete data questions.
02
Sector profile
Quarter-hour values reveal peaks and baseload consumption.
03
Where the money is
Cost, capacity and anomalies come together in an action view.
COMCAM supports the Dutch and European aquaculture sector

The approach
A flat profile with a great deal at stake behind it.
In a farming system, power is not a cost item but a condition of life: pumps, aeration and water treatment literally keep the stock alive. COMCAM guards that flat profile continuously, so every deviation is an early signal rather than an expensive surprise.
Recognise
The baseload becomes visible per installation: pumps, aeration, cooling and treatment each get their own signature in the profile.
Monitor
A farming profile should be flat. Every unexpected wave or dip is an early signal about a pump, a valve or a setting.
Steer
Expansion and electrification are substantiated with the actual profile, including in the conversation with the grid operator about connection capacity.
Where aquaculture often runs into trouble.
Energy Intelligence is positioned differently for each sector. The value lies in recognisable situations, not in generic dashboards.
Continuous pump and aeration consumption
Water treatment and filtration
Temperature control
Operational reliability and back-up
The energy model
Aquaculture
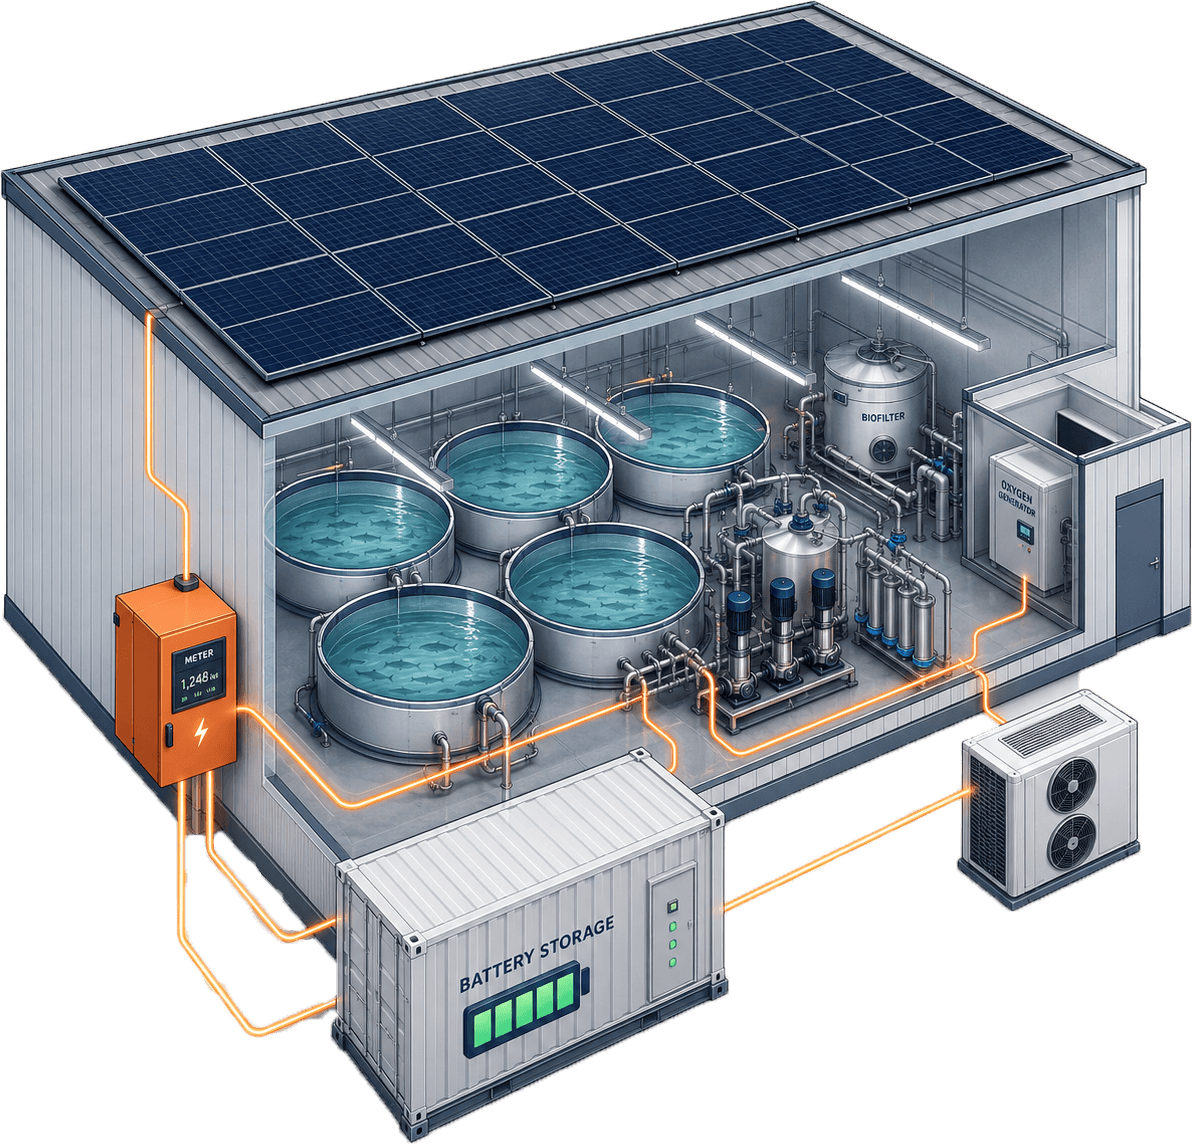
Where consumption, generation and steering come together in this sector: from meters and cooling to solar panels and charging infrastructure.
Sector profile
The farming profile: flat and vital, because continuity is the whole business here.
Day profile in quarter-hour valuesContinuous pump load
Circulation, aeration and filtration always run. Small deviations in this flat profile are big signals.
Feeding and process moments
Feeding systems and cleaning draw recognisable small peaks. Their regularity is a health check of the installation.
Night equals day
A RAS has no closing time. That is exactly why every trend in the baseload is meaningful.
Contracted capacity
Aeration and cooling peak together in warm weather. The profile shows how much margin remains then.
Where the money is
Three insights that make the difference in aquaculture.
A flat profile exposes deviations like no other
Where offices have a day-night rhythm, a farm should run flat. A creeping rise in pump load points to fouling, wear or a control fault, weeks before it becomes a failure.
Energy per kilo of product is the real KPI
Absolute consumption says little with growing biomass. Consumption per kilo of feed or per kilo of growth makes batches and systems comparable.
Continuity hangs on the grid, and on your margin to it
Downtime is not an option and backup power is expensive. Knowing how close you are to your capacity limit in warm weather or at full load is risk management, not bookkeeping.
Energy Intelligence for aquaculture.
Start with Consumption Analysis per meter. You only add Financial Analysis and Capacity Analysis when they add value.
Consumption Analysis
Base rate per meter for consumption, locations and trends.
Book a no-obligation callRead on in the knowledge base.
In-depth articles on exactly these questions: substantiation, practical examples and step-by-step plans.
Sector: Aquaculture
Energy monitoring for aquaculture and RAS: running continuously, knowing continuously
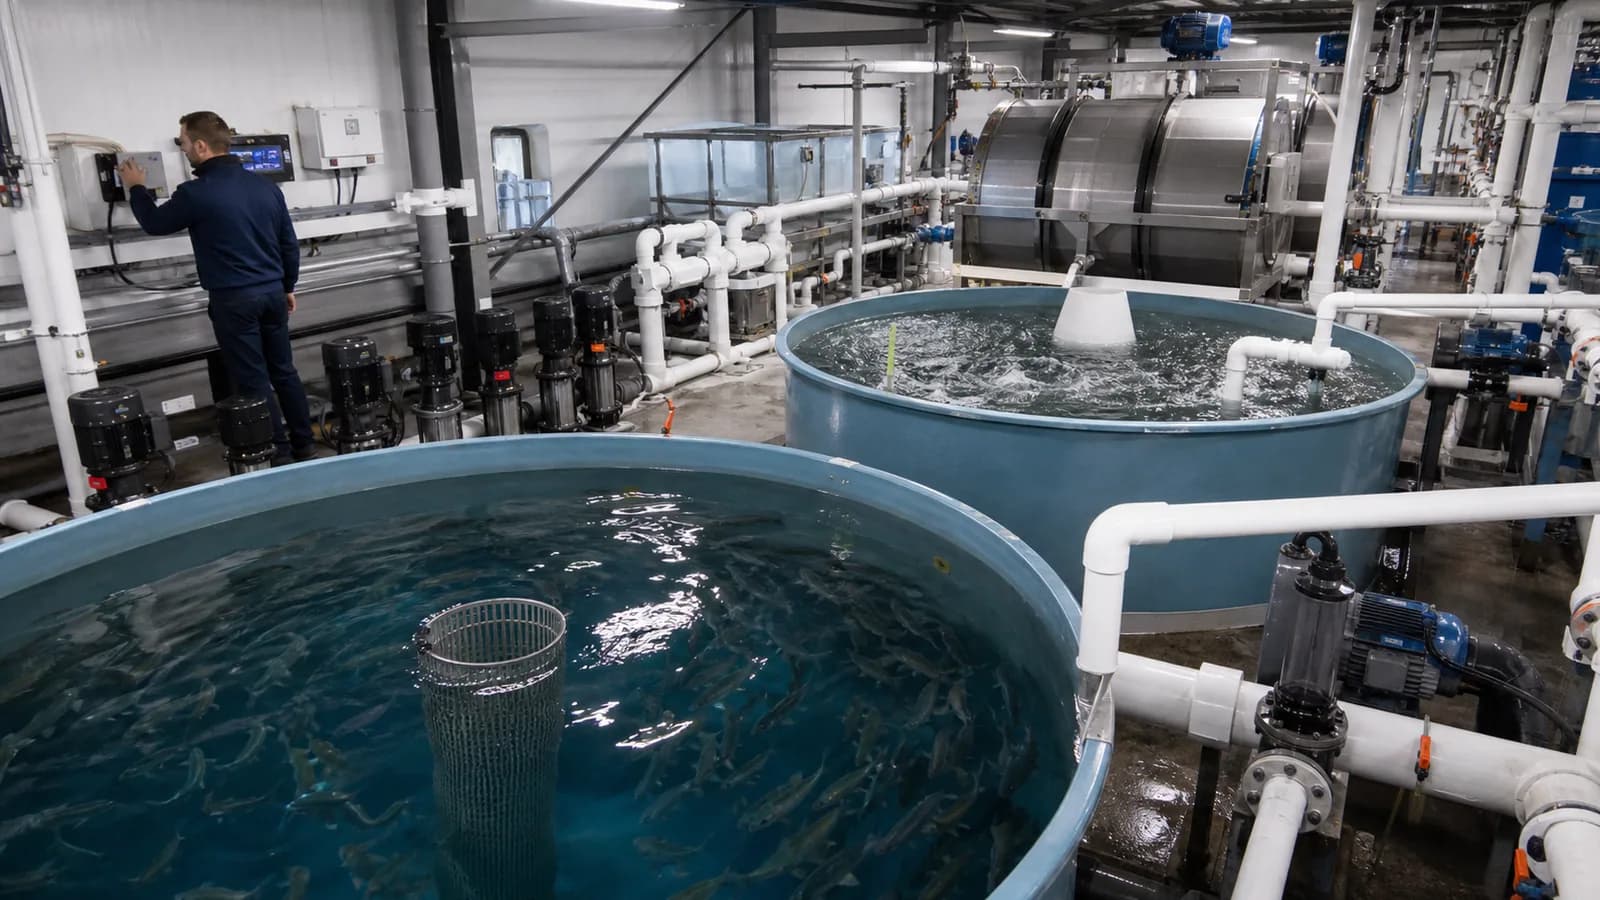
In a recirculating aquaculture system (RAS) almost everything runs continuously: pumps, aeration, biofilter, water treatment and temperature control. That makes the energy profile flat, so waste never stands out by itself; a small deviation carries through into the entire annual consumption. COMCAM establishes a baseline per system and flags every shift early, so you cut costs and recognise creeping consumption as an early signal of wear or fouling, without ever touching operational reliability.
Read article
Grid congestion
Which grid congestion solution suits my company?
A good grid congestion solution starts with insight into peaks, simultaneity, contracted transport capacity and flexibility. Only then does it become clear whether spreading, smart charging, battery storage, process control, energy hub agreements or contract optimisation is the best route.
Read article
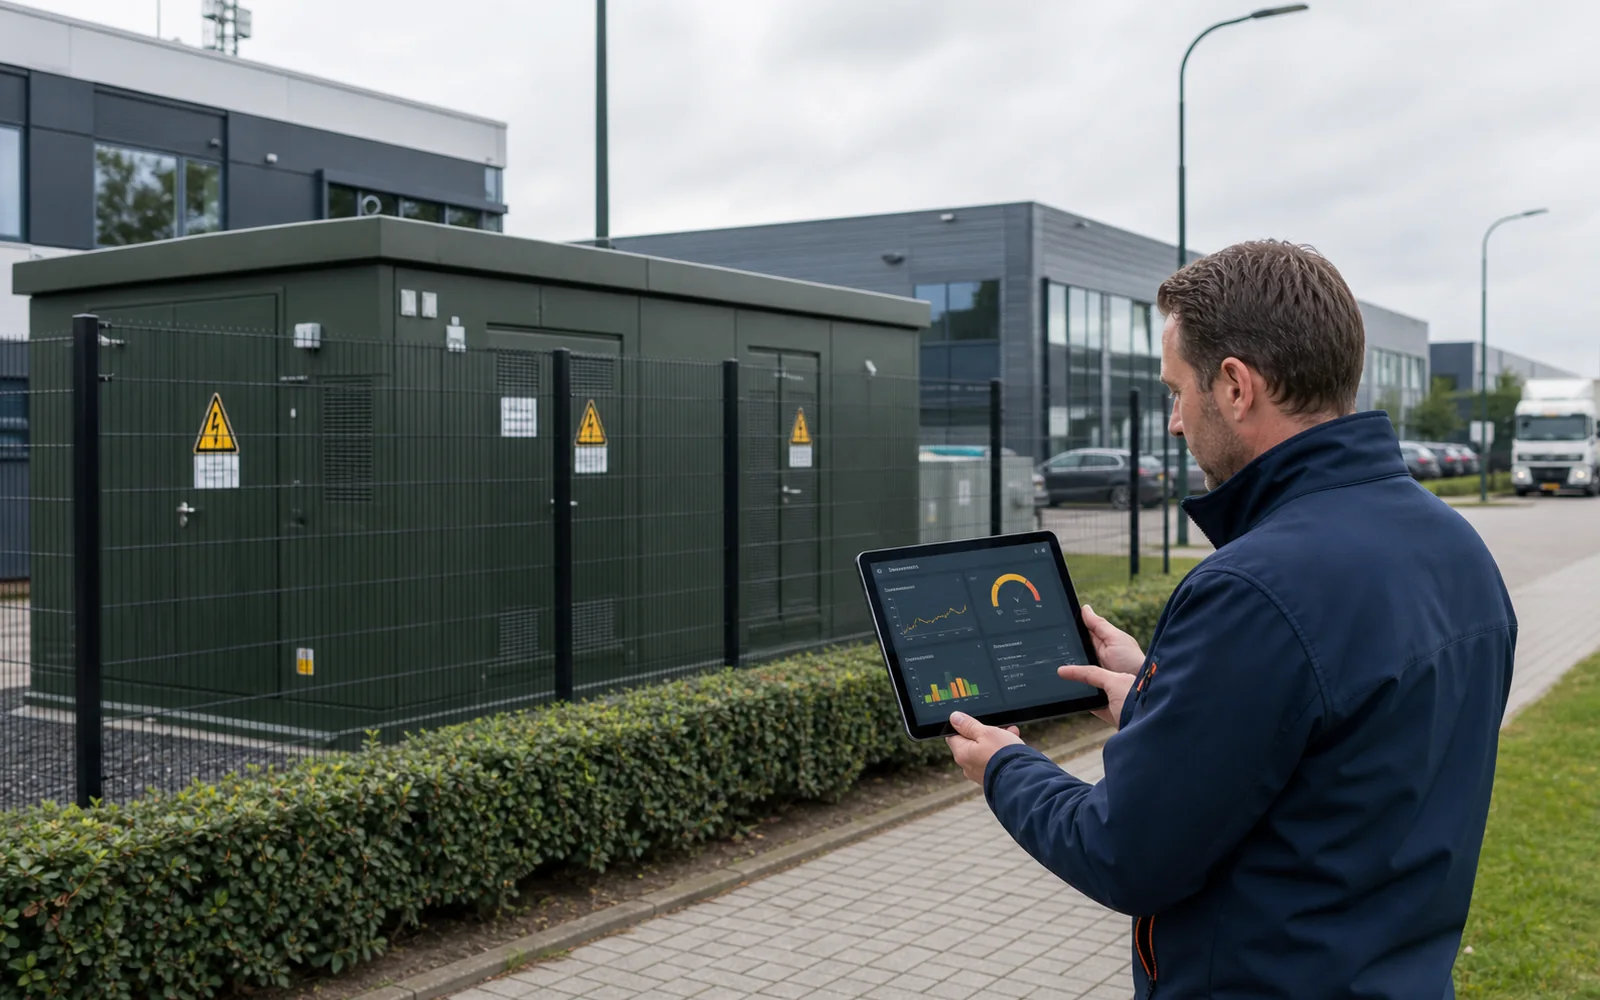
Congestion management
What is congestion management and why is it important now?
Congestion management is the controlling, limiting or shifting of electricity demand or supply when the electricity grid has insufficient capacity. It is important now because companies increasingly face limited grid capacity, electrification and waiting times for heavier connections.
Read article
Frequently asked questions about energy insight in aquaculture.
From metering data and savings opportunities to capacity, regulation and a practical start.
01Where is the first measurable saving opportunity in aquaculture?
A flat profile exposes deviations like no other. Where offices have a day-night rhythm, a farm should run flat. A creeping rise in pump load points to fouling, wear or a control fault, weeks before it becomes a failure.
02Which deviations and decisions become visible through comparison in aquaculture?
Energy per kilo of product is the real KPI. Absolute consumption says little with growing biomass. Consumption per kilo of feed or per kilo of growth makes batches and systems comparable.
03Which strategic decision can the energy profile substantiate?
Continuity hangs on the grid, and on your margin to it. Downtime is not an option and backup power is expensive. Knowing how close you are to your capacity limit in warm weather or at full load is risk management, not bookkeeping.
04Which patterns appear in the energy profile of aquaculture?
Continuous pump load: Circulation, aeration and filtration always run. Small deviations in this flat profile are big signals. Feeding and process moments: Feeding systems and cleaning draw recognisable small peaks. Their regularity is a health check of the installation.
05How does capacity analysis support expansion or electrification?
Aeration and cooling peak together in warm weather. The profile shows how much margin remains then. COMCAM compares quarter-hour values with contracted capacity, so additional demand can be assessed before investment decisions are made.
06Which energy data does COMCAM need for aquaculture?
The foundation consists of quarter-hour values per meter and location. Where available, COMCAM adds gas data, contracted capacity, tariffs, operating hours and relevant asset data. Access is arranged through authorisation or an existing data connection.
07Are additional sensors or submeters always required?
No. Existing smart meters and telemetry data are the logical starting point. Submetering is only added where the main profile cannot answer a specific process question with sufficient precision.
08Which Dutch energy-saving obligations may apply to a location?
In the Netherlands, the energy-saving obligation currently applies from 50,000 kWh of electricity or 25,000 m³ of natural-gas equivalent per location per year. Measures with a payback period of no more than 5 years must be implemented. An extension to 7 years is intended for 1 July 2027, but the five-year threshold remains in force until the change is final. The exact obligation depends on the location, use and activity.

Get in touch
Let your energy data work for you.
Book a no-obligation call. We discuss your energy question, look at your own metering data and whether structural insight adds value.
- Response within one working day
- Dashboard with your own data
- Supplier-independent
- No commitments