
Sector: Greenhouse horticulture
Article 14 of 20 · Sector-specific softwareGetting a grip on greenhouse energy costs: CHP, lighting and crop plan in one view
Direct answer
Getting a grip on greenhouse energy costs begins where the climate computer stops: by bringing gas consumption, electricity, CHP running hours, grid export and lighting together into a financial picture per crop and per section. COMCAM lays that energy profile, supplier-independently, alongside your crop plan, so you can see whether the greenhouse did what the planning promised, and where running hours, screen positions or lighting blocks leave money on the table.
- Gas, electricity and CHP in one view
- Energy profile alongside the crop plan
- Costs per section and crop
- Screen and buffer anomalies visible
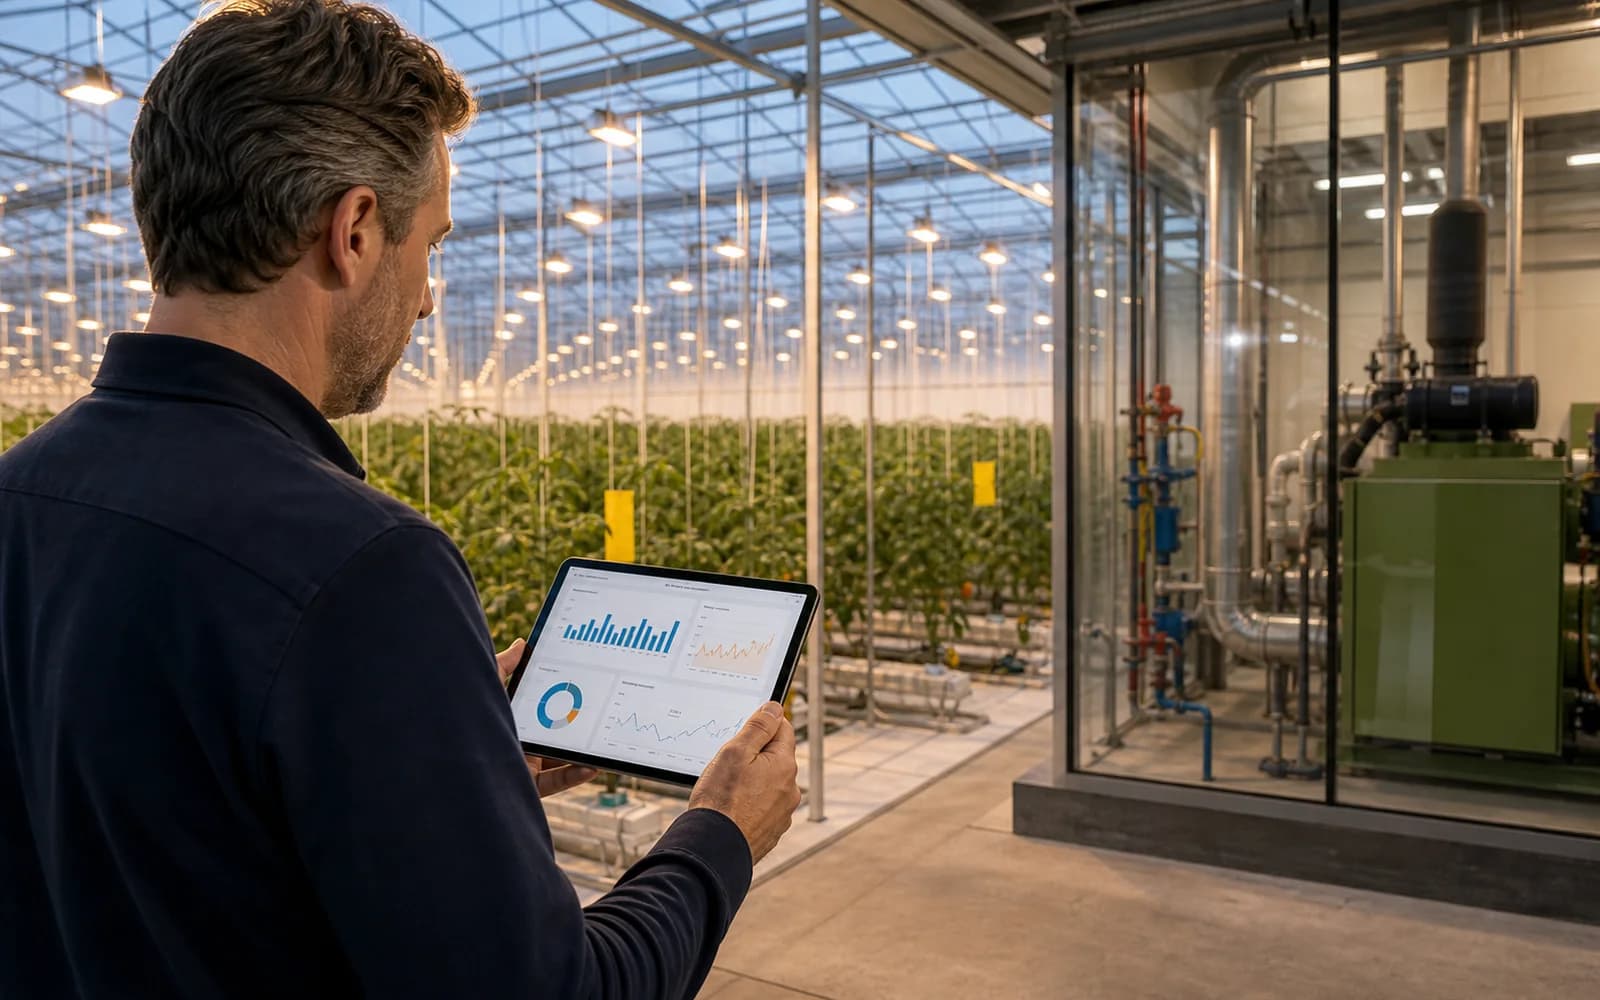
Separate invoices and systems versus one linked energy picture
A modern greenhouse is tightly run: the climate computer controls screens, lighting, CO2 and the heat buffer according to the crop plan. But where the climate is right to the degree, the financial picture often lags behind. Gas sits on one invoice, electricity and grid export on another, the CHP running hours in a system of their own. As for what a lighting block really cost, nobody knows precisely. COMCAM brings those streams together supplier-independently and lays them alongside your crop plan. Then it shows whether the night the screen stayed open is also visible on the meter, whether the CHP ran in the hours that were worth it, and which section is out of step per square metre. The grower gains a cost picture next to the climate picture, and energy decisions become as well-founded as cropping decisions.
Key points
Overview
Traditional approach
Gas, electricity and CHP live in separate systems.
Modern approach
All energy streams sit together in one profile.
Verification
Traditional approach
The crop plan is checked on climate, not on cost.
Modern approach
The actual profile is laid alongside plan and blocks.
Anomalies
Traditional approach
An open screen or empty buffer only shows on the settlement.
Modern approach
Deviations from the expected profile are flagged early.
Decisions
Traditional approach
Energy choices lean on experience and gut feeling.
Modern approach
Running hours and lighting are financially substantiated.
Your greenhouse already has a plan; your energy data does not yet
The crop plan determines when to light, how the screens operate and what the buffer must do. The climate computer executes that, but nobody systematically checks whether energy consumption also kept to the plan. That gap is exactly where the money sits: a screen cloth that stayed open one night because of a fault, a lighting block that ran longer than planned, a buffer that ran empty too early so the boiler had to step in. By laying the quarter-hourly gas and electricity data alongside the plan, those anomalies become visible while you can still act, instead of months later on the settlement.
- Quarter-hourly gas and electricity data alongside the crop plan.
- Lighting blocks recognisably reflected in the profile.
- Screen positions and buffer use mirrored against consumption.
- Anomalies flagged while adjusting is still possible.
- History per crop retained, even after a contract switch.
CHP, grid export and the hours that are worth it
For operations with a CHP, the question is not just how much it runs, but when. Running hours, own use and grid export should tell one story together: did the CHP deliver at the moments that were worth most, or did it mainly run because it always does? By bringing running hours, boiler use and export into one picture, you see where the profile grates against crop demand or market conditions. Even without active trading that insight is valuable: it substantiates maintenance windows, the balance between CHP and boiler, and the conversation with your supplier or adviser.
- Running hours, own use and grid export in context.
- CHP deployment mirrored against crop demand and moment value.
- The balance between CHP and boiler substantiated.
- A fixed reference picture for talks with supplier or adviser.
- A foundation for later steps towards flexibility and steering.
Starting modularly with COMCAM
You start with the meter data your connections already deliver and link it to the context of your operation: sections, crops and the plan. The model is modular with a fixed price per meter per month, finalised once the scope is set. Consumption insight forms the base; financial analysis and capacity analysis are switched on once cost price per crop or the connection is on the agenda. In a no-obligation call you discuss how your own greenhouse is reflected in the data: the profile of your lighting, your buffer and your CHP, not that of an average operation.
- Start on existing gas and electricity meter data.
- Context of sections, crops and crop plan added.
- Fixed price per meter per month, modularly extendable.
- Final price once the scope is set.
- A no-obligation call about the profile of your own greenhouse.
Curious what this looks like with your own data?
In a no-obligation call, a specialist looks at your meters, sites and energy questions with you. Response within one business day.
Where this adds value directly
CHP profile
See running hours, boiler use and grid export together.
Cost price
Trace energy costs back to section and crop.
Anomalies
Flag screens, blocks and buffer that deviate.
Frequently asked questions
Practical answers to common questions about this topic.
Question not covered here?
Ask a specialist directly. You will get a response within one business day.
Ask your questionDoes this replace my climate computer?
No, it complements it. The climate computer runs the greenhouse; COMCAM makes financially visible what that control cost in energy and whether the actual profile matched the plan. The climate picture and the cost picture sit side by side.
Does this also work without a CHP?
Yes. For operations with only a boiler and lighting, or with a heat pump, bringing gas and electricity profiles together alongside the crop plan is just as valuable. The CHP analysis is a deepening for those who have one, not a requirement.
Can I see energy costs per crop or section?
Yes. By linking meters and, where needed, intermediate metering to sections and crops, it becomes visible what a cropping cycle cost in energy. That makes cost-price calculations and choices between crops better substantiated.
What does this cost for a growing operation?
The model is modular with a fixed price per meter per month, so costs scale with the number of connections and meters. The final price is set once the scope is defined, for instance the number of meters and desired modules.
Does my history stay usable if I switch supplier?
Yes. COMCAM is supplier-independent, so your meter data and history are retained across contracts. That continuity matters especially for multi-year comparisons between crops and seasons.
What is the core of greenhouse energy costs?
Getting a grip on greenhouse energy costs begins where the climate computer stops: by bringing gas consumption, electricity, CHP running hours, grid export and lighting together into a financial picture per crop and per section. COMCAM lays that energy profile, supplier-independently, alongside your crop plan, so you can see whether the greenhouse did what the planning promised, and where running hours, screen positions or lighting blocks leave money on the table.
What data do I need for greenhouse energy costs?
Start with quarter-hour meter data, invoices, contract data and site characteristics. That makes greenhouse energy costs concrete, comparable and easier to follow up, rather than just a separate report.
When does this topic become relevant for my organisation?
As soon as it touches costs, grid capacity, reporting or daily operations. Also consider related themes such as reduce greenhouse energy costs, chp running hours insight and lighting energy use greenhouse.
Series · Sector-specific software
All 20 articlesSearch the knowledge base
Find the answer to your question.
Search using your own words. Abbreviations and spelling variants are recognised, so EMS also finds the articles on energy management systems.
Topic
Useful next steps
Curious what this means for your organisation?
Book a no-obligation call and discover it with your own energy data.